Some Linux command line tools that can be used to monitor network usage.
These tools monitor the traffic that flows through the network interfaces and measure the speed with which data is being transferred. Inbound and outbound traffic is shown separately.
Some of the commands show the bandwidth used by individual processes. This makes it easier to detect a process that is using the network bandwidth too much.
The tools have different mechanisms for generating the traffic report. Here is a list of the commands, classified by their resources.
1. Nload
Nload is a command line tool that allows users to monitor incoming and outgoing traffic separately.
It also draws a graph to indicate the same, whose scale can be adjusted. Easy and simple to use and does not support many options.
So, if you just need to take a quick look at the total bandwidth usage without details of individual processes, nload will be useful.
Installation example on a Linux distro:
emerge nload # Gentoo, Funtoo, ...
sudo apt install nload # Debian, Ubuntu, Mint, ...
sudo pacman -S nload # Arch, Manjaro, ...
sudo dnf install nload # Red Hat, CentOS, Fedora, ...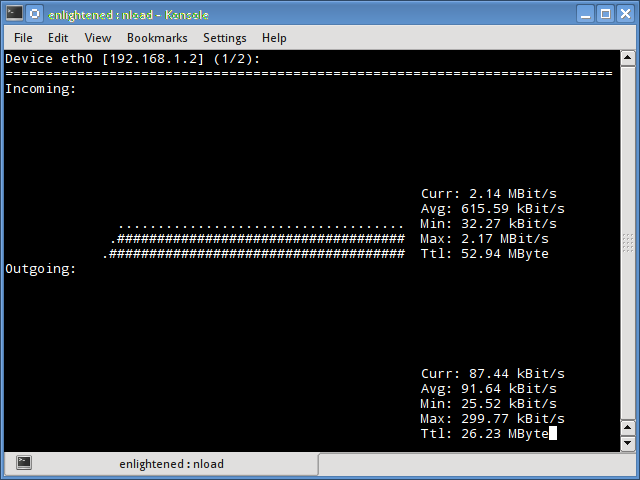
Example of use:
nload2. iftop
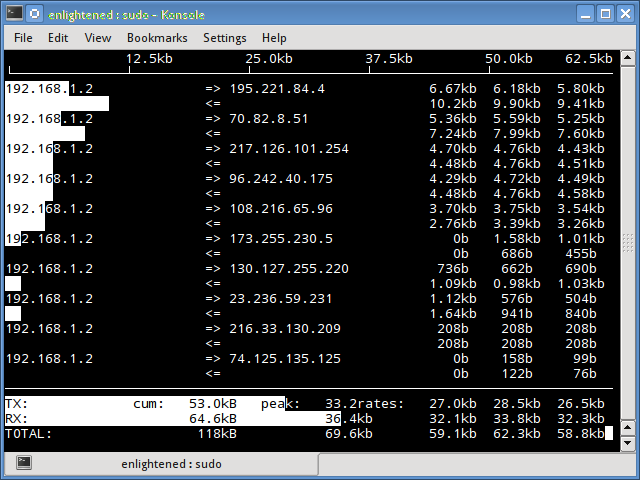
Iftop measures the data that flows through individual socket connections and works differently than Nload.
Iftop uses the pcap library to capture the incoming and outgoing packets from the network adapter and then adds the size and count to find the total bandwidth in use.
Although iftop reports the bandwidth used by individual connections, it cannot report the name/id of the process involved in the specific socket connection.
But, being based on the pcap library, iftop is able to filter traffic and report bandwidth usage on selected host connections, as specified by the filter.
Installation example on a Linux distro:
emerges iftop # Gentoo, Funtoo, ...
sudo apt install iftop # Debian, Ubuntu, Mint, ...
sudo pacman -S iftop # Arch, Manjaro, ...
sudo dnf install iftop # Red Hat, CentOS, Fedora, ...
Example of use:
iftop -n3. iptraf
Iptraf is an interactive and colorful IP Lan monitor. It shows the individual connections and the amount of data flowing between the hosts.
Installation example on a Linux distro:
emerges iptraf # Gentoo, Funtoo, ...
sudo apt install iptraf # Debian, Ubuntu, Mint, ...
sudo pacman -S iptraf # Arch, Manjaro, ...
sudo dnf install iptraf # Red Hat, CentOS, Fedora, ...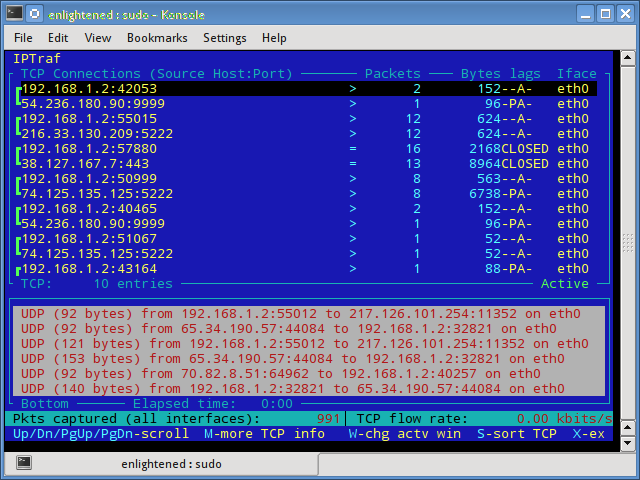
Example of use:
iptraf4. nethogs
Nethogs is a small ‘net top’ tool that shows the bandwidth used by individual processes and ranks the list by placing the most intense processes at the top.
In the event of a sudden increase in bandwidth, quickly open the nethogs and find out who is responsible for the process. Nethogs informs the PID, the user and the program path.
Installation example on a Linux distro:
nethogs emerge # Gentoo, Funtoo, ...
sudo apt install nethogs # Debian, Ubuntu, Mint, ...
sudo pacman -S nethogs # Arch, Manjaro, ...
sudo dnf install nethogs # Red Hat, CentOS, Fedora, ...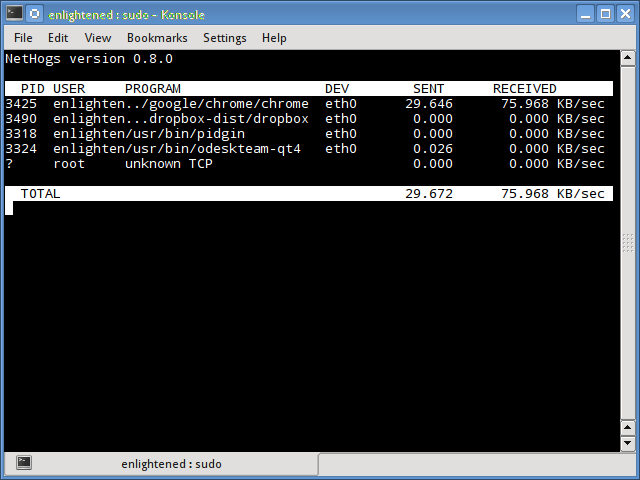
Example of use:
nethogs5. bmon
Bmon (Bandwidth Monitor) is a tool similar to nload that shows the traffic load on all network interfaces in the system. The output also consists of a graph and a section with details at the package level.
Installation example on a Linux distro:
bmon emerges # Gentoo, Funtoo, ...
sudo apt install bmon # Debian, Ubuntu, Mint, ...
sudo pacman -S bmon # Arch, Manjaro, ...
sudo dnf install bmon # Red Hat, CentOS, Fedora, ...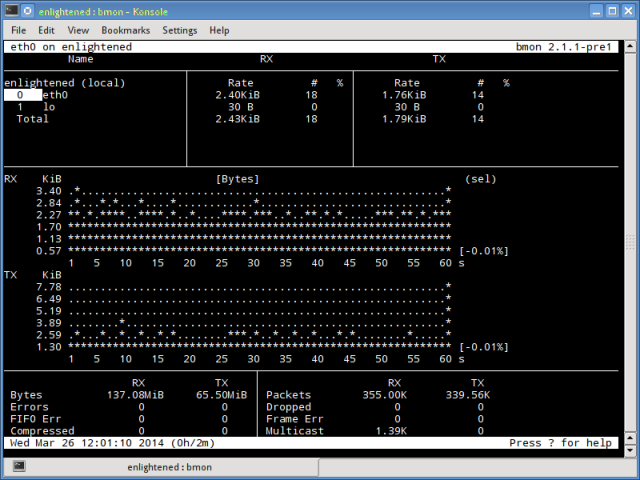
Example of use:
bmon6. slurm
Slurm is “more” another network load monitor that shows device statistics along with an ASCII graph. It supports 3 different styles of graphs, each of which can be activated using the keys c, s and l. Simple in resources, slurm no longer displays details about the network load.
Installation example on a Linux distro:
emerge slurm # Gentoo, Funtoo, ...
sudo apt install slurm # Debian, Ubuntu, Mint, ...
sudo pacman -S slurm # Arch, Manjaro, ...
sudo dnf install slurm # Red Hat, CentOS, Fedora, ...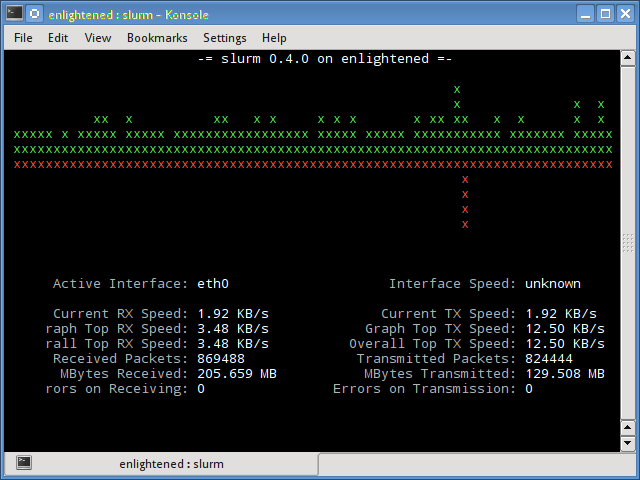
Example of use:
slurm -s -i eth0
7. tcptrack
Tcptrack is similar to iftop and uses the pcap library to capture packets and calculate various statistics, such as the bandwidth used for each connection.
It also supports standard pcap filters that can be used to monitor specific connections.
Installation example on a Linux distro:
emerges tcptrack # Gentoo, Funtoo, ...
sudo apt install tcptrack # Debian, Ubuntu, Mint, ...
sudo pacman -S tcptrack # Arch, Manjaro, ...
sudo dnf install tcptrack # Red Hat, CentOS, Fedora, ...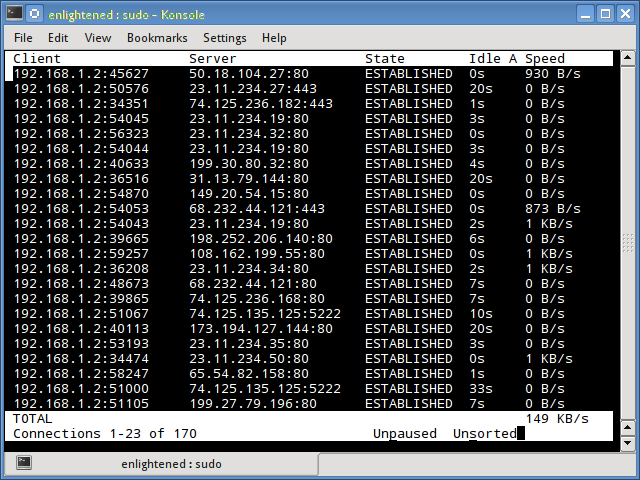
Example of use:
tcptrack8. Vnstat
Vnstat is slightly different from most other tools. In fact, it runs a service/daemon in the background and keeps recording the size of the data transfer all the time.
It can then be used to generate a network usage history report.
Installation example on a Linux distro:
emerge vnstat # Gentoo, Funtoo, ...
sudo apt install vnstat # Debian, Ubuntu, Mint, ...
sudo pacman -S vnstat # Arch, Manjaro, ...
sudo dnf install vnstat # Red Hat, CentOS, Fedora, ...
Running vnstat without any options would simply show the total amount of data transfer that has occurred since the date the daemon is running.
$ vnstat
Database updated: Mon Mar 17 15:26:59 2020
   eth0 since 06/12/13
          rx:  135.14 GiB      tx:  35.76 GiB      total:  170.90 GiB
   monthly
                     rx      |     tx      |    total    |   avg. rate
     ------------------------+-------------+-------------+---------------
       Feb '14      8.19 GiB |    2.08 GiB |   10.27 GiB |   35.60 kbit/s
       Mar '14      4.98 GiB |    1.52 GiB |    6.50 GiB |   37.93 kbit/s
     ------------------------+-------------+-------------+---------------
     estimated      9.28 GiB |    2.83 GiB |   12.11 GiB |
   daily
                     rx      |     tx      |    total    |   avg. rate
     ------------------------+-------------+-------------+---------------
     yesterday    236.11 MiB |   98.61 MiB |  334.72 MiB |   31.74 kbit/s
         today    128.55 MiB |   41.00 MiB |  169.56 MiB |   24.97 kbit/s
     ------------------------+-------------+-------------+---------------
     estimated       199 MiB |      63 MiB |     262 MiB |
To monitor bandwidth usage in real time, use the ‘-l’ option (live mode). It would then show the total bandwidth used by the input and output data, but in a very precise way, without any internal details about host connections or processes.
Example of use:
$ vnstat -l -i eth0
Monitoring eth0...    (press CTRL-C to stop)
   rx:       12 kbit/s    10 p/s          tx:       12 kbit/s    11 p/s
9. bwm-ng
Bwm-ng (Bandwidth Monitor Next Generation) is another very simple real-time network load monitor that reports a summary of the speed at which data is being transferred into and out of all available network interfaces in the system.
Installation example on a Linux distro:
emerges bwm-ng # Gentoo, Funtoo, ...
sudo apt install bwm-ng # Debian, Ubuntu, Mint, ...
sudo pacman -S bwm-ng # Arch, Manjaro, ...
sudo dnf install bwm-ng # Red Hat, CentOS, Fedora, ...
If the size of the console is large enough, bwm-ng can also draw bar charts for traffic using the curses2 output mode.
Example of use:
bwm-ng -o curses210. cbm - Color bandwidth meter
A small, simple bandwidth monitor that displays the volume of traffic through network interfaces. There are no more options, only traffic statistics are displayed and updated in real time.
Installation example on a Linux distro:
emerge cbm # Gentoo, Funtoo, ...
sudo apt install cbm # Debian, Ubuntu, Mint, ...
sudo pacman -S cbm # Arch, Manjaro, ...
sudo dnf install cbm # Red Hat, CentOS, Fedora, ...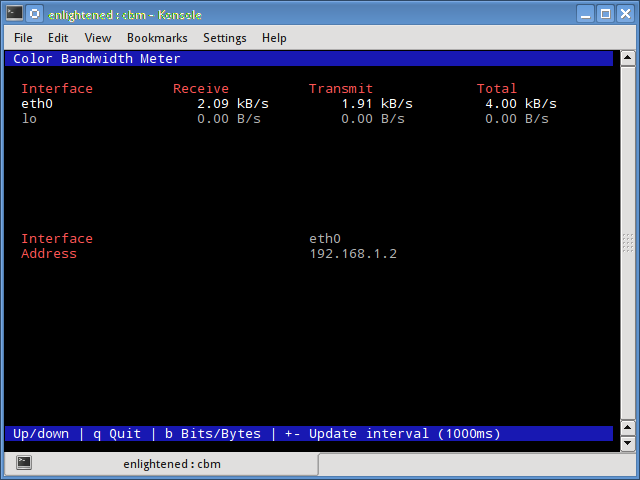
Example of use:
cbm11. speedometer
Another small and simple tool that only draws beautiful graphics of incoming and outgoing traffic through a given interface.
Installation example on a Linux distro:
speedometer emerges # Gentoo, Funtoo, ...
sudo apt install speedometer # Debian, Ubuntu, Mint, ...
sudo pacman -S speedometer # Arch, Manjaro, ...
sudo dnf install speedometer # Red Hat, CentOS, Fedora, ...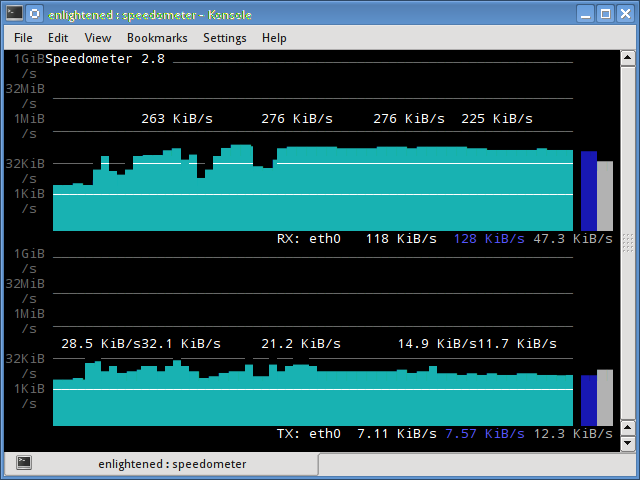
Example of use:
speedometer12. Pktstat
Pktstat displays all active connections in real time and the speed with which data is being transferred through them.
It also displays the connection type, that is, tcp or udp and also details about HTTP requests, if involved.
Installation example on a Linux distro:
emerges pkstat # Gentoo, Funtoo, ...
sudo apt install pkstat # Debian, Ubuntu, Mint, ...
sudo pacman -S pkstat # Arch, Manjaro, ...
sudo dnf install pkstat # Red Hat, CentOS, Fedora, ...
Example of use:
pktstat -i eth0 -nt13. Netwatch
Netwatch is part of the netdiag tool collection and also displays the connections between the local host and other remote hosts and the speed with which data is transferred over each connection.
Installation example on a Linux distro:
netwatch emerges # Gentoo, Funtoo, ...
sudo apt install netwatch # Debian, Ubuntu, Mint, ...
sudo pacman -S netwatch # Arch, Manjaro, ...
sudo dnf install netwatch # Red Hat, CentOS, Fedora, ...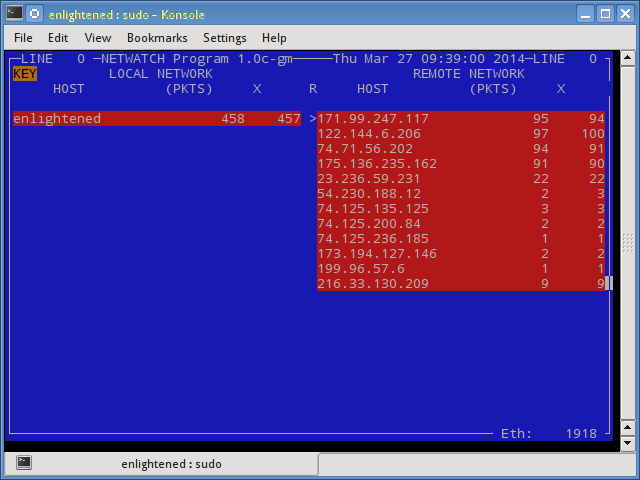
Example of use:
netwatch -e eth0 -nt14. Trafshow
Like netwatch and pktstat, trafshow reports the current active connections, their protocol and the data transfer speed for each connection. It can filter connections using pcap filters. Monitor only tcp connections.
Installation example on a Linux distro:
emerges trafshow # Gentoo, Funtoo, ...
sudo apt install trafshow # Debian, Ubuntu, Mint, ...
sudo pacman -S trafshow # Arch, Manjaro, ...
sudo dnf install trafshow # Red Hat, CentOS, Fedora, ...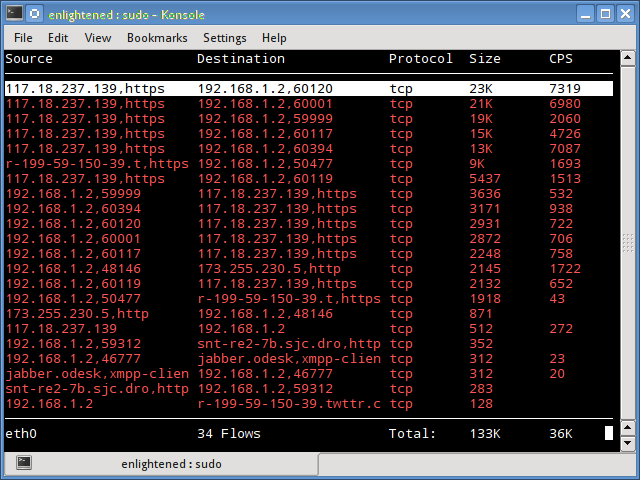
Example of use:
trafshow -i eth0 tcp15. Netload
netload is a very simple network traffic viewer for the terminal. It shows a moving bar graph representing incoming network traffic and a small box with RX and TX traffic in kilobytes.
Installation example on a Linux distro:
netload emerges # Gentoo, Funtoo, ...
sudo apt install netload # Debian, Ubuntu, Mint, ...
sudo pacman -S netload # Arch, Manjaro, ...
sudo dnf install netload # Red Hat, CentOS, Fedora, ...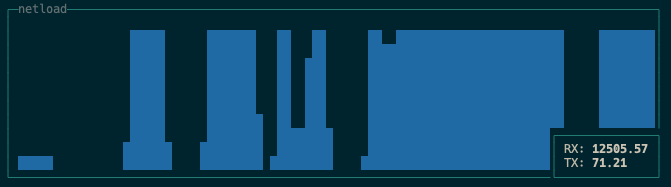
Example of use:
netload eth016. ifstat
Ifstat reports the network bandwidth in a batch style mode. The output is in an easy format to record and analyze using other programs or utilities.
Installation example on a Linux distro:
emerges ifstat # Gentoo, Funtoo, ...
sudo apt install ifstat # Debian, Ubuntu, Mint, ...
sudo pacman -S ifstat # Arch, Manjaro, ...
sudo dnf install ifstat # Red Hat, CentOS, Fedora, ...
Example of use:
ifstat -t -i eth0 0.5
  Time           eth0
HH:MM:SS   KB/s in  KB/s out
09:59:21      2.62      2.80
09:59:22      2.10      1.78
09:59:22      2.67      1.84
09:59:23      2.06      1.98
09:59:23      1.73      1.79
17. dstat
Dstat is a versatile tool (written in python) that can monitor different system statistics and report them in a batch mode or record the data in a csv or similar file. This example shows how to use dstat to report network bandwidth.
Installation example on a Linux distro:
emerge dstat # Gentoo, Funtoo, ...
sudo apt install dstat # Debian, Ubuntu, Mint, ...
sudo pacman -S dstat # Arch, Manjaro, ...
sudo dnf install dstat # Red Hat, CentOS, Fedora, ...
Example of use:
dstat -nt
-net/total- ---- system ----
 recv send | team
   0 0 | 23-03 10:27:13
1738B 1810B | 23-03 10:27:14
2937B 2610B | 3/23 10:27:15 AM
2319B 2232B | 23-03 10:27:16
2738B 2508B | 03/23 10:27:17
18. collectl
Collectl reports system statistics in a style similar to dstat and, like dstat, gathers statistics about several different system resources, such as CPU, memory, network, etc.
Here is a simple example of how to use it to report network usage/bandwidth.
Installation example on a Linux distro:
emerges collectl # Gentoo, Funtoo, ...
sudo apt install collectl # Debian, Ubuntu, Mint, ...
sudo pacman -S collectl # Arch, Manjaro, ...
sudo dnf install collectl # Red Hat, CentOS, Fedora, ...
Example of use:
collectl -sn -oT -i0.5
waiting for 0.5 second sample...
#         <----------Network---------->
#Time       KBIn  PktIn  KBOut  PktOut
10:32:01      40     58     43      66
10:32:01      27     58      3      32
10:32:02       3     28      9      44
10:32:02       5     42     96      96
10:32:03       5     48      3      28
Summary
These were some useful commands to quickly check the network bandwidth on your Linux server. However, they do require the user to log in to the remote server using ssh.
Alternatively, web-based monitoring tools can also be used for the same task.
In addition, there are enterprise-grade monitoring tools, such as Nagios, that provide a number of features to monitor not just one server, but the entire infrastructure.
If you want to create your own solution it is very simple, for more details watch this video(Portuguese Brazilian)