Several programming languages are available for creating graphics and visualizing data. Python is one of the “richest” libraries in this regard, matplotlib is one of the most used. The R programming language is also one of the best in this regard and we can mention ggplot2.
But what if you are looking for an even faster and easier way to view data stored in a plain text file. And maybe you don’t want to leave the comfort of the terminal? You may be interested in Termgraph.
Installing Termgraph
You must use pip to install it, example:
python -m pip install termgraphAlternatively you can use pipx:
pipx install termgraphSupported chart types
- Bar Graphs
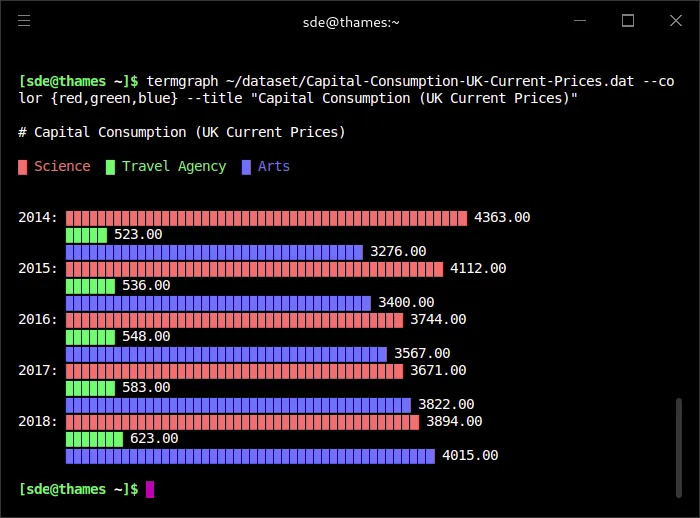
- Color charts
- Multi-variable
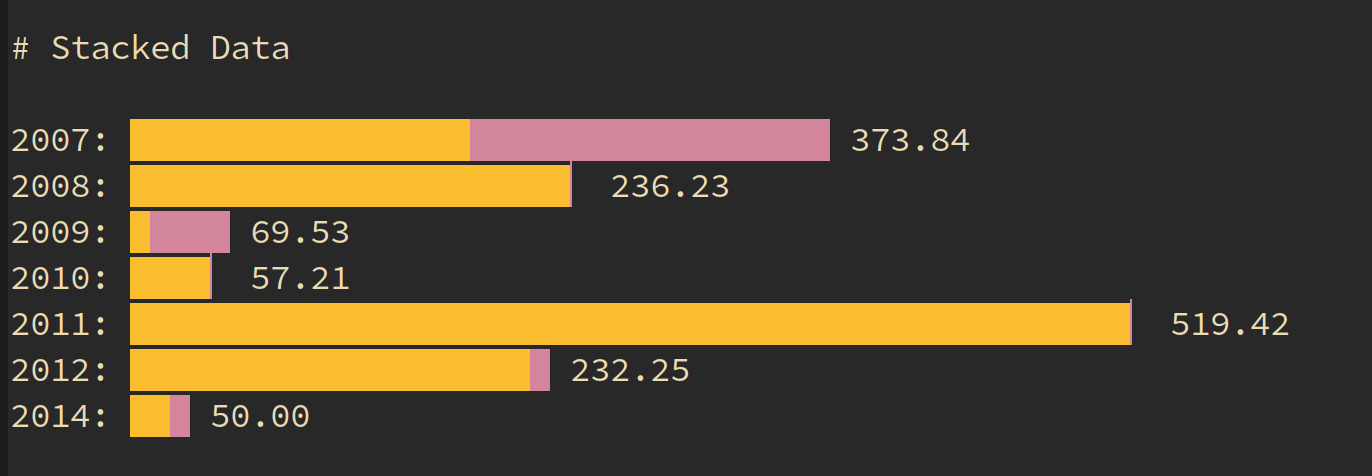
- Stacked charts
- Histograms
- Horizontal or Vertical
- Emoji!
Usage examples
- Read data from
data/ex1.datfile
termgraph data/ex1.dat

2007: ▇▇▇▇▇▇▇▇▇▇▇▇▇▇▇▇▇ 183.32
2008: ▇▇▇▇▇▇▇▇▇▇▇▇▇▇▇▇▇▇▇▇▇▇ 231.23
2009: ▇ 16.43
2010: ▇▇▇▇ 50.21
2011: ▇▇▇▇▇▇▇▇▇▇▇▇▇▇▇▇▇▇▇▇▇▇▇▇▇▇▇▇▇▇▇▇▇▇▇▇▇▇▇▇▇▇▇▇▇▇▇▇▇▇ 508.97
2012: ▇▇▇▇▇▇▇▇▇▇▇▇▇▇▇▇▇▇▇▇ 212.05
2014: ▏ 1.00- Using custom colors
For more forms of use, run:
termgraph -hAnd you can still contribute to the project, Termgraph’s GitHub: https://github.com/mkaz/termgraph.