What is a Profiler?
A profiler is a tool used to measure and analyze the performance of a software program.
It helps developers identify bottlenecks, optimize resource usage, and improve code efficiency.
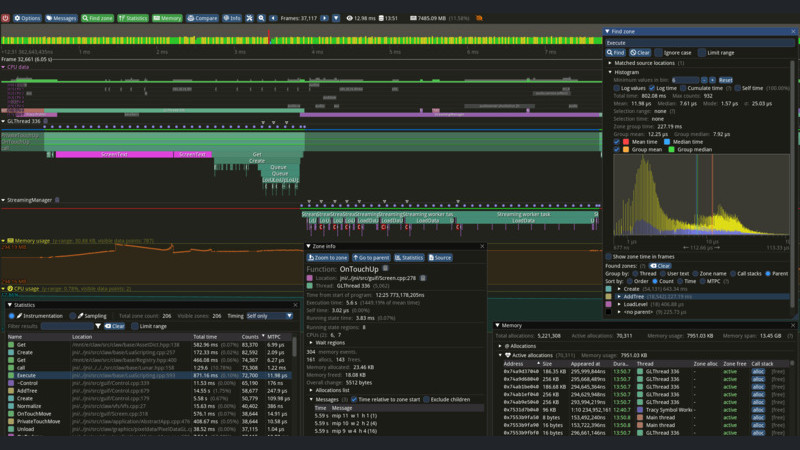
Tracy Profiler is an example of a profiler that stands out for being a real-time performance analysis tool for applications written in C++.
Features of a Profiler like Tracy:
1. Performance Measurement:
- Execution Time: Measures the time it takes for each part of the code to be executed.
- CPU and Memory Usage: Analyzes CPU and memory consumption, identifying areas that may be causing slowness or wasted resources.
2. Data Visualization:
- Graphs and Reports: Generates detailed graphs and reports that help you visualize application performance.
- Timeline: Displays a timeline of function executions, allowing a detailed analysis of the execution flow.
3. Identification of Bottlenecks:
- Slow Functions: Identifies which functions are consuming the most CPU time.
- Locks and Deadlocks: Detects concurrency problems, such as locks and deadlocks.
4. Real-Time Analysis:
- Immediate Feedback: Provides immediate feedback during program execution, allowing real-time adjustments and optimizations.
5. Integration with Development Environments:
- Debug Tools: Can be integrated with debug tools for more in-depth analysis.
- Support for Multiple Platforms: Works on multiple platforms, such as Windows, macOS and Linux.
How Tracy Profiler Stands Out:
- Low Overhead: Tracy is designed to have minimal overhead, meaning it does not significantly impact application performance while profiling is active.
- Intuitive User Interface: Provides an intuitive graphical user interface (GUI) for viewing profiling data.
- Advanced Features: Offers advanced features, such as call stack capture, memory allocation analysis, and support for multithreaded systems.
Usage Examples:
- Game Development: Optimization of game performance, where every millisecond counts for a fluid experience.
- Real-Time Applications: Performance analysis of applications that require fast and consistent responses.
- Enterprise Software: Identifying and resolving bottlenecks in large enterprise software systems to improve efficiency and scalability.
In short, a profiler like Tracy is an essential tool for any developer who wants to ensure their software works efficiently and without performance issues.
What tools was Tracy Profiler developed with?
Tracy Profiler is a sophisticated profiling tool developed with a combination of several technologies and libraries that support its functionality and graphical interface.
The main tools and libraries used in the development of Tracy Profiler are:
1. C++:
- The main language used to develop Tracy Profiler. C++ is a common choice for performance tools because of its efficiency and low-level control over system resources.
2. Dear ImGui:
- A GUI library for C++ that makes it easy to create intuitive, high-performance GUIs. Tracy uses Dear ImGui to build its user interface, allowing developers to view profiling data interactively and in real time.
3. OpenGL:
- A graphics API used for rendering. Tracy uses OpenGL along with Dear ImGui to design the graphical interface and performance graphs.
4. GLFW:
- A library that provides a simple interface for creating windows, OpenGL contexts, and capturing input events. GLFW is used in Tracy to manage windows and keyboard and mouse input.
5. Capstone Disassembly Framework:
- A cross-platform disassembly framework used for binary code analysis. In Tracy, Capstone is used for advanced profiling functions that involve analyzing machine code.
6. miniz:
- A zlib/deflate compression library used for data compression. Tracy uses miniz to compress profiling data, facilitating efficient data transmission and storage.
7. Threads and Synchronization (C++ Standard Library):
- Tracy makes extensive use of threads to capture real-time performance data without significantly interfering with the performance of the monitored application.
8. Network Programming (C++ Standard Library):
- To send profiling data from the monitored application to the Tracy user interface, network programming techniques are used.
Development Process
The development of Tracy Profiler involves combining these tools to create an application that is both powerful and efficient.
The integration of Dear ImGui and OpenGL allows for a fluid and responsive graphical interface, while libraries such as GLFW and Capstone provide additional support for advanced profiling functionality.
The use of C++ and compression libraries like miniz ensures that Tracy is able to handle large volumes of performance data efficiently.
Benefits of Choosing These Tools
- Performance: The combination of C++ and OpenGL ensures that Tracy is capable of operating with high performance, crucial for a profiling tool.
- Interactivity: Dear ImGui provides a highly interactive and customizable user interface.
- Portability: Libraries like GLFW and miniz are cross-platform, allowing Tracy to work on different operating systems.
- Advanced Functionality: Using frameworks like Capstone allows for advanced functionality, such as machine code analysis and detailed profiling.
These tools and libraries work together to make Tracy Profiler a robust and effective tool for developers who need to analyze and optimize the performance of their applications.
Installation on Windows
Installation on Windows consists of
- Download from the [releases] page (https://github.com/wolfpld/tracy/releases);
- Unzip the compressed file with extension
.7z; - Enter the extracted folder and double-click on the file:
Tracy.exe
If you want to download it right here, just click the button below:
According to the publication date of this article, the most recent version is
0.10.
Installation on macOS and GNU/Linux distros
On Unix systems: macOS, FreeBSD and GNU/Linux you will first need dependencies at both runtime and compile time.
Use the Package Manager of your operating system, examples: Brew, APT, Pacman, pkg, emerge, …
Example on Ubuntu using APT:
Search these package names for your system!
sudo apt install build-essential libdbus-1-dev libfreetype-dev libtbb-dev libglfw3-devFor Wayland, add:
sudo apt install libxkbcommon-dev libwayland-dev libglvnd-dev.
You also need Capstone installed.
You can try packages from your system’s repositories, but generally these packages (except Gentoo and Ports that compile from source code) have outdated or broken versions, and most have problems executing the binary.
Therefore, it is recommended to remove these packages if they are installed and compile Capstone from source to avoid problems.
So, to use the correct package, you need to remove it if you have already installed it:
sudo apt remove libcapstone-dev --purge
#
sudo apt remove libcapstone3 --purge
# To avoid taking any risks, also run
sudo apt autoremove
sudo apt autoclean
Compile Capstone:
git clone https://github.com/capstone-engine/capstone
git checkout 5.0.1
./make.sh
sudo ./make.sh install
Then add the directory where you downloaded the capstone to the $PKG_CONFIG_PATH environment variable, example:
echo 'export PKG_CONFIG_PATH="/path/to/capstone"' >> ~/.bashrc
exec $SHELL
Clonar, Compilar e Instalar o Tracy Profiler
Agora chegou a hora mais esperada! Rode os comandos na ordem:
git clone https://github.com/wolfpld/tracy
cd tracy
git checkout v0.10
cd profiler/build/unix/
make LEGACY=1 # Para X11 ou só 'make' para Wayland
Se não usar a flag
LEGACY=1em X11 o binário irá abortar a operação após execução. Outra coisa, se nçao fizer checkout na tag(git checkout v0.10), o diretóriobuildnão estará disponível.
Executando:
./Tracy-releaseInstalar:
sudo install -v Tracy-release /usr/local/bin/tracy-profilerUsage
Using Tracy is not so simple for beginners, but there are help, manuals, PDFs, … to help you!
Running:
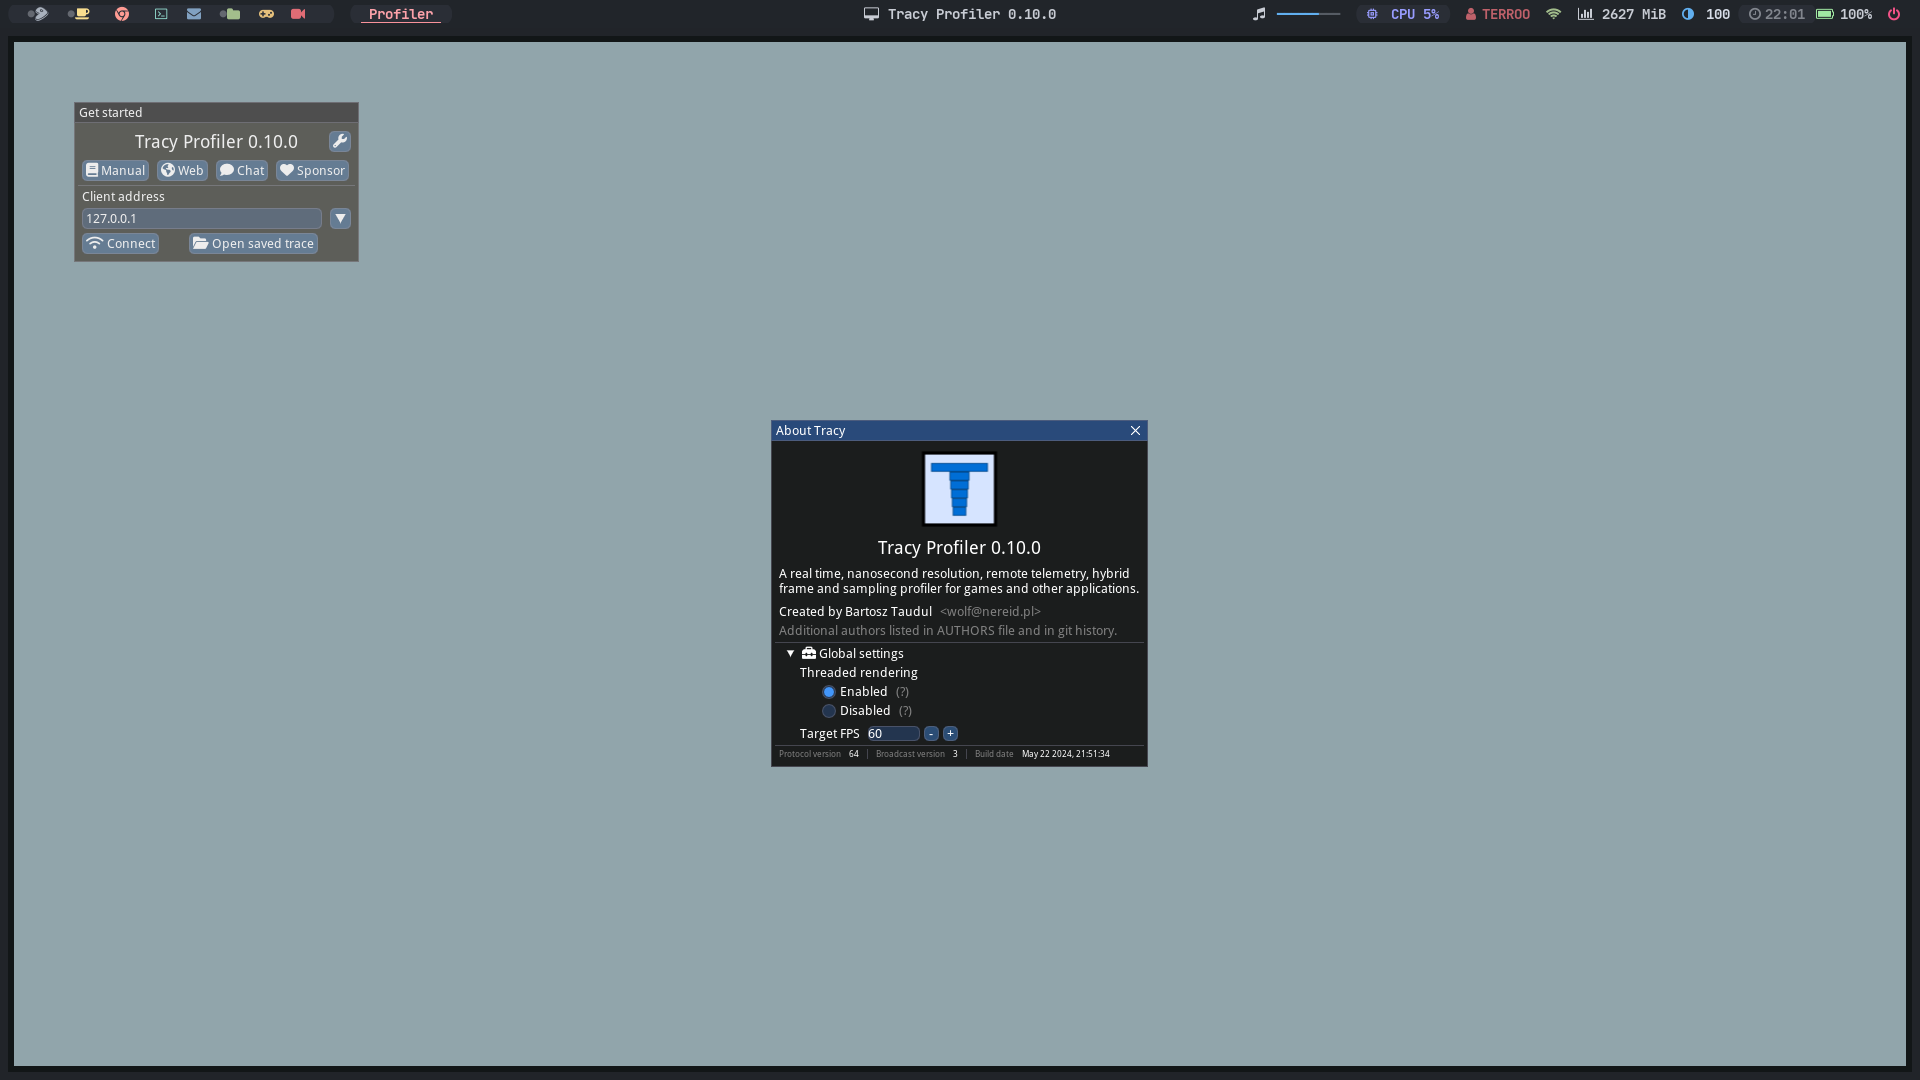
tracy-profilerTracy Profiler running! Click on the image to open in a new tab for a better view.
Using help:
tracy-profiler --helpManual:
wget -q https://github.com/wolfpld/tracy/releases/latest/download/tracy.pdf && xdg-open tracy.pdfExamples
Web Version
Useful links
- https://github.com/wolfpld/tracy
- https://www.youtube.com/watch?v=ghXk3Bk5F2U&ab_channel=CppCon
- https://davespace.xyz/blog/building-tracy-profiler-on-linux
Additional information
If you only clone and compile in a traditional way with CMake or Meson, that’s just install the static library with CMake and the dynamic one with Meson, example:
CMake
git clone https://github.com/wolfpld/tracy
cd tracy
cmake -B build .
cd build && make
sudo make install
Meson
git clone https://github.com/wolfpld/tracy
cd tracy
meson build
ninja
This way you can use the library in your source code for specific applications:
# include <tracy/Tracy.hpp>And use specific directives and flags.
If you want to know the installation locations:
Click here to see the paths
[100%] Built target TracyClient
Install the project...
-- Install configuration: ""
-- Installing: /usr/local/lib64/libTracyClient.a
-- Installing: /usr/local/include/tracy/TracyC.h
-- Installing: /usr/local/include/tracy/Tracy.hpp
-- Installing: /usr/local/include/tracy/TracyD3D11.hpp
-- Installing: /usr/local/include/tracy/TracyD3D12.hpp
-- Installing: /usr/local/include/tracy/TracyLua.hpp
-- Installing: /usr/local/include/tracy/TracyOpenCL.hpp
-- Installing: /usr/local/include/tracy/TracyOpenGL.hpp
-- Installing: /usr/local/include/tracy/TracyVulkan.hpp
-- Installing: /usr/local/include/client/tracy_concurrentqueue.h
-- Installing: /usr/local/include/client/tracy_rpmalloc.hpp
-- Installing: /usr/local/include/client/tracy_SPSCQueue.h
-- Installing: /usr/local/include/client/TracyArmCpuTable.hpp
-- Installing: /usr/local/include/client/TracyCallstack.h
-- Installing: /usr/local/include/client/TracyCallstack.hpp
-- Installing: /usr/local/include/client/TracyCpuid.hpp
-- Installing: /usr/local/include/client/TracyDebug.hpp
-- Installing: /usr/local/include/client/TracyDxt1.hpp
-- Installing: /usr/local/include/client/TracyFastVector.hpp
-- Installing: /usr/local/include/client/TracyLock.hpp
-- Installing: /usr/local/include/client/TracyProfiler.hpp
-- Installing: /usr/local/include/client/TracyRingBuffer.hpp
-- Installing: /usr/local/include/client/TracyScoped.hpp
-- Installing: /usr/local/include/client/TracyStringHelpers.hpp
-- Installing: /usr/local/include/client/TracySysPower.hpp
-- Installing: /usr/local/include/client/TracySysTime.hpp
-- Installing: /usr/local/include/client/TracySysTrace.hpp
-- Installing: /usr/local/include/client/TracyThread.hpp
-- Installing: /usr/local/include/common/tracy_lz4.hpp
-- Installing: /usr/local/include/common/tracy_lz4hc.hpp
-- Installing: /usr/local/include/common/TracyAlign.hpp
-- Installing: /usr/local/include/common/TracyAlloc.hpp
-- Installing: /usr/local/include/common/TracyApi.h
-- Installing: /usr/local/include/common/TracyColor.hpp
-- Installing: /usr/local/include/common/TracyForceInline.hpp
-- Installing: /usr/local/include/common/TracyMutex.hpp
-- Installing: /usr/local/include/common/TracyProtocol.hpp
-- Installing: /usr/local/include/common/TracyQueue.hpp
-- Installing: /usr/local/include/common/TracySocket.hpp
-- Installing: /usr/local/include/common/TracyStackFrames.hpp
-- Installing: /usr/local/include/common/TracySystem.hpp
-- Installing: /usr/local/include/common/TracyUwp.hpp
-- Installing: /usr/local/include/common/TracyYield.hpp
-- Installing: /usr/local/share/Tracy/TracyTargets.cmake
-- Installing: /usr/local/share/Tracy/TracyTargets-noconfig.cmake
-- Installing: /usr/local/share/Tracy/TracyConfig.cmake


