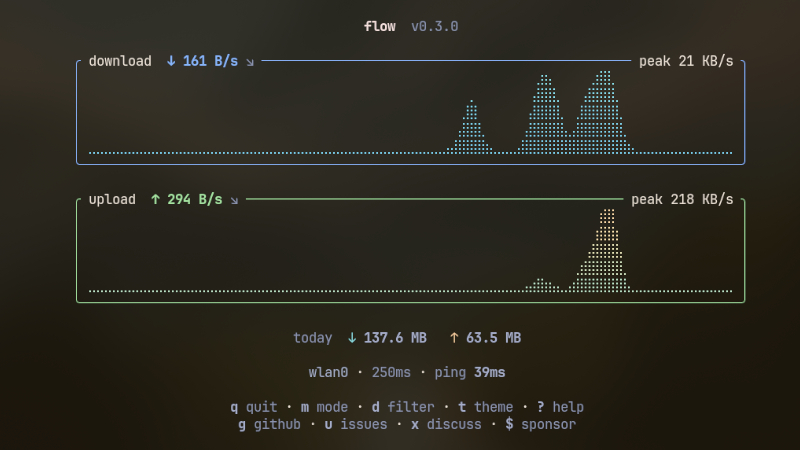
The flow is a real-time network traffic monitor for the terminal.
It is written in Go, uses Bubble Tea for the TUI interface, and works on GNU/Linux, macOS, and Windows.
Features:
- Download speed
- Upload speed
- Traffic graphs
- Transfer peaks
- Latency
- Network interface in use
- Processes with network connections
- Interface information, such as IP, MAC, and MTU
- Session/day traffic totals
- Custom themes and color schemes
The interface automatically adapts to the terminal size, offering four modes: Hero, Compact, Mini, and Tiny.
How to install
The project provides precompiled binaries for Linux, macOS, and Windows, for both amd64 and arm64. There are also platform-specific methods.
GNU/Linux
If you use Arch Linux, you can install it through the AUR:
yay -S flow-network-monitor-bin
Using Go
With Go installed:
go install github.com/programmersd21/flow/cmd/flow@latest
Verify:
flow
Building from source
git clone https://github.com/programmersd21/flow
cd flow
make install
The project also provides binaries directly on the releases page.
macOS
The simplest way is to use Homebrew:
brew install programmersd21/flow/flow
Then:
flow
Windows
On Windows, you can download the binary corresponding to your machine’s architecture from the project’s Releases page.
There are builds for:
amd64
arm64
The release process generates a .zip file for Windows.
After extracting the executable, you can run:
.\flow.exe
If you want to call flow directly from any terminal, add the executable’s folder to the Windows PATH.
Getting started
Once installed, simply run:
flow
The program automatically detects the network interface and starts monitoring.
View modes
You can start directly in different modes:
flow --compact
Compact layout.
flow --mini
Graphs only.
flow --tiny
A single line, ideal for status bars.
For example, the tiny mode can be integrated into tmux:
set -g status-right "#(flow --tiny --no-color)"
Choosing an interface
If the computer has multiple network interfaces:
flow --interface wlan0
You can also switch between interfaces within the application itself using:
i
Changing units
Press:
c
to switch between scales such as:
B/s
KB/s
MB/s
Or start using bits per second:
flow --bits
Changing the refresh interval
By default, flow works with a 100 ms sampling rate.
You can change it:
flow --refresh 500ms
Monitoring latency
You can set the destination used for the latency test:
flow --ping 8.8.8.8
The default address is 1.1.1.1.
Shortcuts
During execution:
| Key | Action |
|---|---|
q |
Quit |
m |
Change view mode |
d |
Download / Upload / Both |
t |
Select theme |
n |
Network processes |
i |
Change interface |
I |
Interface details |
c |
Change unit |
b |
Bits/s ↔ Bytes/s |
+ / - |
Change interval |
p |
Pause/resume |
r |
Reset peaks |
? |
Help |
JSON and automation
flow does not have to be used only as a TUI.
To get a single JSON output:
flow --json
To receive data continuously in JSON Lines:
flow --json-stream
This allows you to integrate flow with scripts, dashboards, and other terminal tools.
There is also:
flow --once
to get a single text output.
For more information, visit the repository.